How we built a free AI automation diagnostic (and why)

Describe a role or department — get automation score, ROI estimate, and a solution proposal in under 5 minutes. Free, no consultant required.
Most companies know they should be doing something with AI automation. Very few know where to start, which roles to target, or what the real return would be.
So they hire a consultant. Pay €5K for a discovery phase. Wait four weeks. Get a report full of “opportunities” with no real numbers attached.
We built a different answer.
The problem nobody talks about

AI automation is no longer a future thing. It’s happening now, in companies your size, in roles that look a lot like yours.
But the barrier isn’t capability — it’s clarity.
“Which role do I start with?"
"What would it actually cost to automate this?"
"Is it worth it? When would I break even?”\
These are reasonable questions. They deserve real answers. Not “it depends” from a €500/day consultant. Not a vague promise that “AI can transform your operations.”
Structured estimates, grounded in your role, in minutes. Not a guarantee — but a real starting point.
What you can analyze
One of the first design decisions we made: the tool should work for whatever level of the organization you’re thinking about.
A specific role — “Sales Development Representative”, “Finance Manager”, “Customer Support Agent”. The analysis breaks the role into its component tasks and assesses each one independently.
A full department — “Customer Success team of 8”, “Finance & Accounting department”. Useful when you want to understand the automation landscape across a function before deciding where to focus.
A set of tasks — “Monthly invoice reconciliation and supplier payment cycle”. Useful when you already know the process you want to target and just want a rigorous assessment of what’s automatable and what’s not.
Not sure what to analyze? Check the examples section on the site — it shows real analyses across roles, departments, and task sets. Good for inspiration, or just to see the tool in action before you commit to running your own.
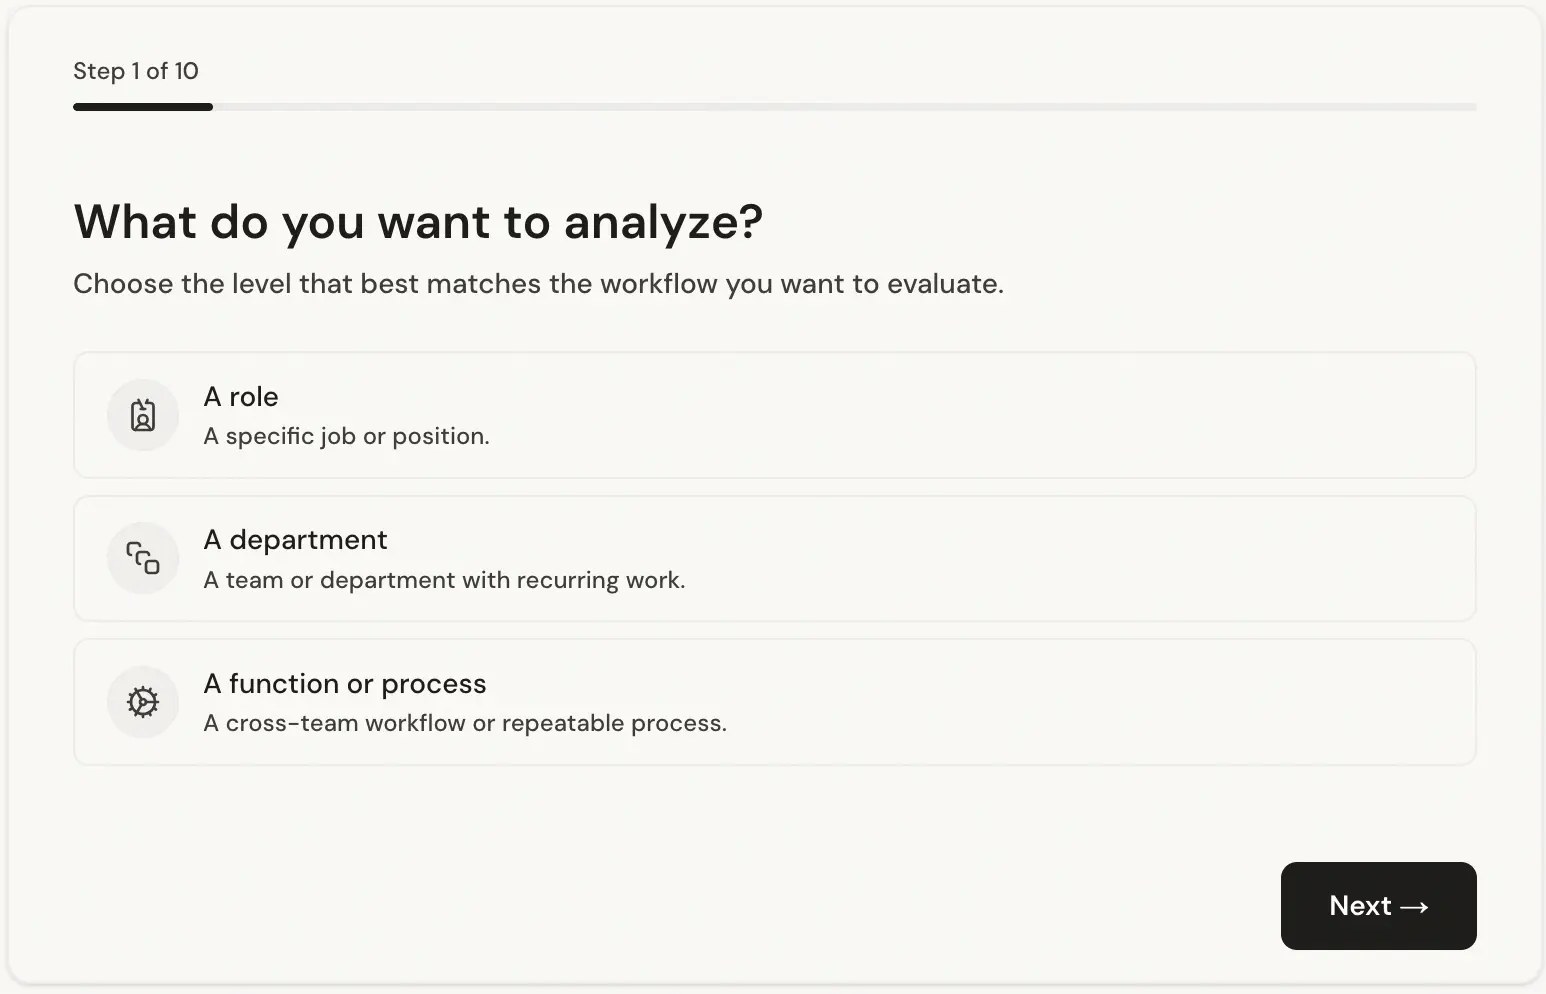
The form: designed for humans, not for technical people
Most AI tools that ask for structured input are built for people who already understand AI. That was never the goal here.
We spent significant engineering effort on the form itself — not just the analysis engine behind it. The result is a guided, conversational input flow that the vast majority of users complete in under one minute, regardless of their technical background.
It asks only what it needs. Plain language questions. One step at a time. No jargon, no dropdowns full of AI terminology, no requirement to know what an “LLM” is or what “automation” means in technical terms.
The form is deliberately narrow — it asks about the work, not about technology. You describe what a person does or what a process involves. The system figures out the rest.
This matters because the quality of the analysis depends entirely on the quality of the input. A form that intimidates people or requires prior knowledge produces bad data and bad analysis. The form we built gets honest, detailed answers from non-technical users — and that makes the output meaningful.
A note on ethics: this is not a tool for deciding who to fire

This is worth saying clearly.
Can I Hire an AI? is not a tool for evaluating whether a person’s job should be eliminated.
That framing gets the whole thing backwards. The question isn’t “can a machine replace this person?” The question is “how much of this person’s time is spent on repetitive, low-judgment tasks that a machine could handle — so they can spend more time on the work that actually requires a human?”
The analysis measures automatable hours, not headcount reduction potential.
The output tells you: out of the 160 hours a month this role works, roughly 90 hours involve tasks that follow predictable patterns and could be handled by automation. That frees 90 hours for the strategic, relational, judgment-intensive work that genuinely needs a person.
The goal is to make the human role more valuable — not to make it disappear.
We’ve oriented every part of the tool around this framing: the questions it asks, the labels it uses, the way results are presented. If you’re looking for a tool to justify layoffs, this isn’t it. If you’re looking for a tool to help your team spend less time on the tedious and more time on the meaningful — that’s exactly what it’s for.
The technical engine (for those who want to know how it works)
This isn’t a chatbot wrapper. Under the hood, the analysis runs through a multi-node LangGraph pipeline.
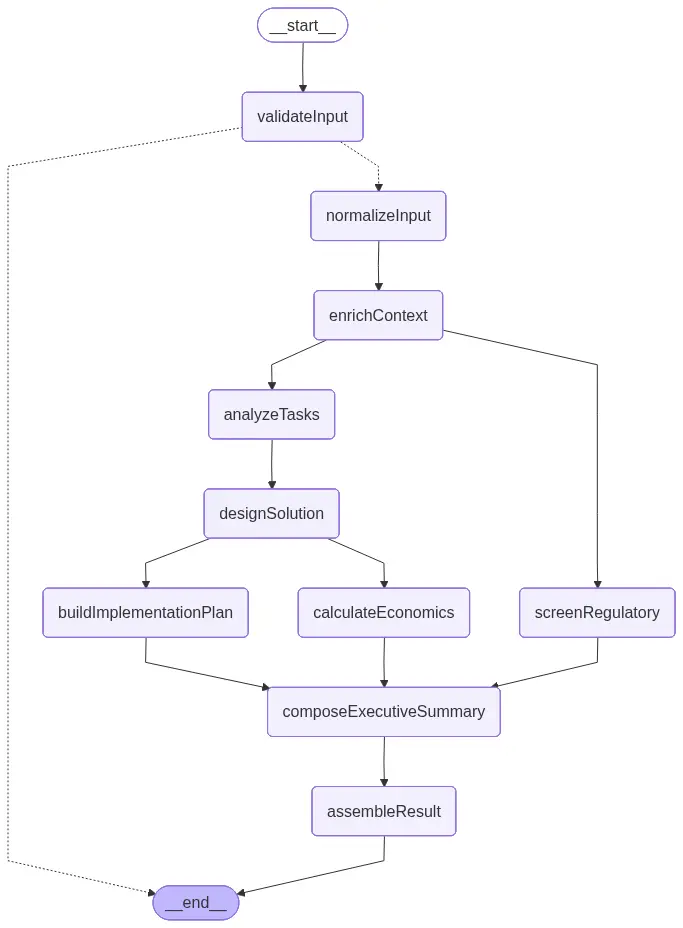
Each node has a specific job. Task analysis breaks the role into discrete activities and assesses each one independently. Regulatory screening checks for compliance constraints. Solution design produces a concrete automation architecture. The economic model runs month-by-month projections over 36 months.
Security: defense-in-depth, not trust-and-hope
A tool that accepts free-text input from anonymous users needs to think seriously about what people put into it. We did.
The validation pipeline runs three independent layers before any LLM sees your input:
Layer one: deterministic screening. Before anything else, a regex-based guardrail scans every field for PII signatures — email addresses, phone numbers, URLs, and long digit sequences that look like card numbers. Prompt injection patterns are matched against a curated set of known attack phrases: “ignore all previous instructions”, “act as”, “jailbreak”, and variants. These checks are entirely code-based — no model, no inference cost, no chance of a model being fooled into letting something through.
Layer two: sanitization. Every field is Unicode-normalized (NFKC), stripped of control characters, and truncated to defined length limits. What reaches the model is a clean, bounded string — not whatever the user typed verbatim.
Layer three: Azure Content Safety. Azure OpenAI runs its own PII detection and jailbreak detection at the infrastructure level, independent of the application. If a request slips through the application layer, the model infrastructure is a separate, independent backstop.
The result is that prompt injection attempts, PII leakage, and manipulation of the analysis pipeline hit multiple independent barriers — not one overloaded system trying to do everything.
Regulatory compliance is not optional — and most agencies treat it like it is
AI automation deployments fail for many reasons. Technical problems, adoption resistance, poor scoping. But one of the most avoidable failure modes — and one of the least discussed — is running into regulatory constraints after the system is already built.
There’s a category of agency that will build you an automation, hand it over, and walk away. Fast turnaround, low cost, no frills. They don’t flag that your sector has specific rules about automated decision-making. They don’t mention that German companies above a certain headcount need Works Council approval before deploying workflow-control tools. They don’t check whether your use of personal data in an AI pipeline creates GDPR obligations you weren’t expecting. That’s your problem, six weeks after go-live.
The regulatory screening in this tool isn’t an afterthought or a generic disclaimer. It runs as a dedicated node in the analysis pipeline — parallel to the task analysis, not bolted on at the end — and it takes the full context into account: the specific country, the sector, the tasks being automated, and the type of organization.
What the output actually looks like
The video above walks through a complete analysis. You can see how the tool moves from a role description to a structured report: the automation score at the top, each task scored individually below it, the economics section with month-by-month projections, a phased implementation timeline, and the regulatory flags at the bottom.
Every section is generated from your input — not a generic template.
What you’ll get
AI-Readiness Score: An overall percentage of the work that AI could handle, based on task-level analysis. Not a guess: each task is scored independently, and the overall figure is derived from those scores weighted by time.
Task Breakdown: Every task scored individually. You see exactly which parts of the work AI can handle and which remain distinctly human — and why. This is the section that changes how people think about automation. The question stops being “can AI do this job?” and starts being “which hour of the day is this?”
Productivity and Economics: Hours recovered, capacity value, estimated savings, implementation cost, ROI, and payback period. Built on a non-linear adoption curve, not a flat assumption. See the section below on how these estimates are calculated and what they assume.
Implementation Plan: A phased timeline with concrete steps for introducing AI into the workflow progressively. Discovery and design first, then a supervised pilot, then full deployment. It tells you what to do in what order — not just that automation is possible.
Regulatory Readiness: A practical view of the legal and policy framework relevant to the automation: GDPR obligations, EU AI Act requirements, and sector- or country-specific rules that apply. Not legal advice — but a structured starting point that most agencies skip entirely.
How the economic estimates are calculated — and what they assume
The economic figures are the part of the analysis that gets the most attention, and they deserve the most scrutiny. Here’s exactly what the model does and where its limits are.
What it calculates
The model runs month-by-month projections over 36 months. Every month, it computes:
monthly net = (annual productivity value / 12 × adoption rate) − monthly recurring costYear-1 ROI accumulates months 1–12 against the upfront implementation cost. Payback period is the first month where the cumulative position turns positive. Steady-state ROI uses months 25–36, once adoption has plateaued.
The adoption curve
This is the part most automation calculators get wrong. They assume full productivity from month one. That’s not how automation works in practice.
The model uses a non-linear adoption ramp based on how real deployments behave:
| Month | Adoption rate |
|---|---|
| 1-3 | 30% |
| 4-6 | 60% |
| 7-12 | 85% |
| 12-24+ | 95% |
Between anchors, the model interpolates linearly. The implication: year-1 returns are always lower than steady-state returns, because the system spends the first year being rolled out, tested, and adopted by the team. This makes the projections more conservative and more realistic than a flat-line assumption.
The realization rate
For a single role, the model assumes 100% of the projected productivity value is realizable. For a department or team, it applies a 70% realization rate — because 30% of the theoretical gain tends to be absorbed by reclassification overhead, QA processes, and change management. This isn’t pessimism; it’s what the data from real deployments shows.
What the model doesn’t know
The tool infers everything from your description. It doesn’t have access to your actual payroll data, real task durations, your specific IT stack, or your internal change management capacity. The salary assumptions, task time allocations, and implementation cost ranges are industry-derived estimates for the role type you described — not figures pulled from your HR system.
What this means practically: the output is a directional analysis, not an audited projection. If the tool says year-1 ROI of 180%, that’s the model’s estimate given typical costs and adoption patterns for this kind of automation. Whether your specific implementation lands at 140% or 220% depends on execution quality, team adoption speed, integration complexity, and a dozen other factors the tool can’t see.
Use it to understand the order of magnitude and the relative case for automating this role versus others. Don’t use it as a business case to present to your CFO without running it through your actual numbers.
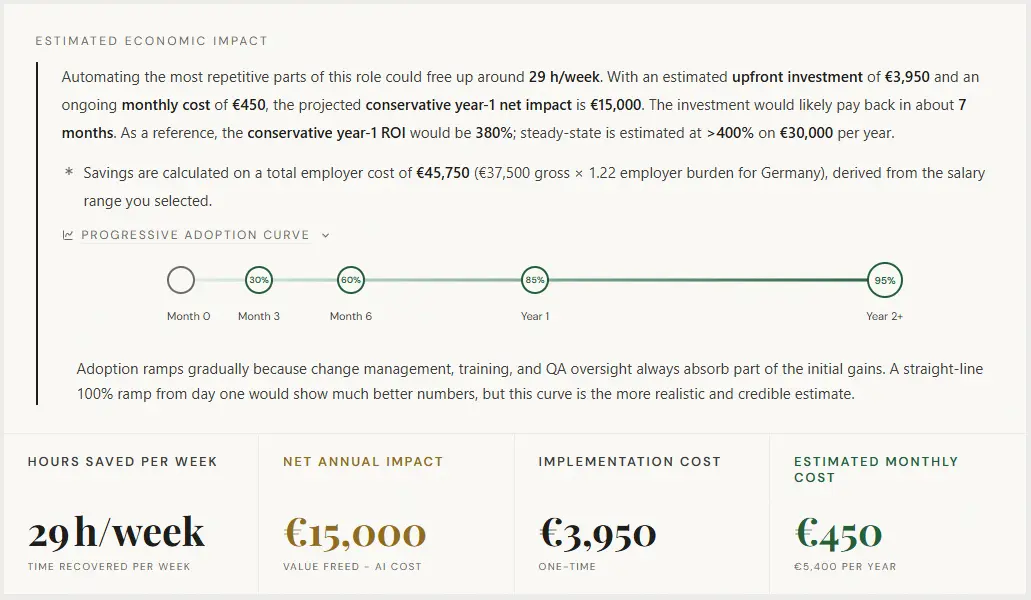
A real example: Data Entry Operator in Germany
This is a real output for a Data Entry Operator role in a German administration context: invoice entry into an ERP, cross-referencing documents against spreadsheets and emails, and flagging discrepancies for approval.
To see what a complete report looks like, view the full example analysis →
| Metric | Value |
|---|---|
| Overall automation score | 82% |
| Implementation cost | €3,950 |
| Annual savings | €15,000 |
| ROI | 380% |
| Payback period | Month 7 |
The 380% ROI figure is the model’s output for this specific role type — a highly repetitive, rules-based data entry function with a low implementation cost and a clear automation path. It’s not representative of every role. A more complex role with higher implementation cost and lower task repeatability will produce different numbers. The example is here to show the depth of the output, not to suggest every analysis will look like this.
The implementation plan runs 10 weeks across three phases: three weeks mapping the document and ERP flows, four weeks running a supervised pilot with daily staff review of exceptions, and three more weeks scaling automated routing and tuning matching accuracy.
The regulatory section flags three areas at medium-to-high risk: GDPR obligations around personal data in business documents, EU AI Act requirements for human oversight and usage documentation, and German co-determination rules — specifically, that Works Council involvement may be required before workflow-control tools go live. That last point is the kind of thing a no-code agency won’t raise. It’s also the kind of thing that can stop a deployment six weeks in.
The analysis is free for everyone. For 5 companies, the implementation is too.
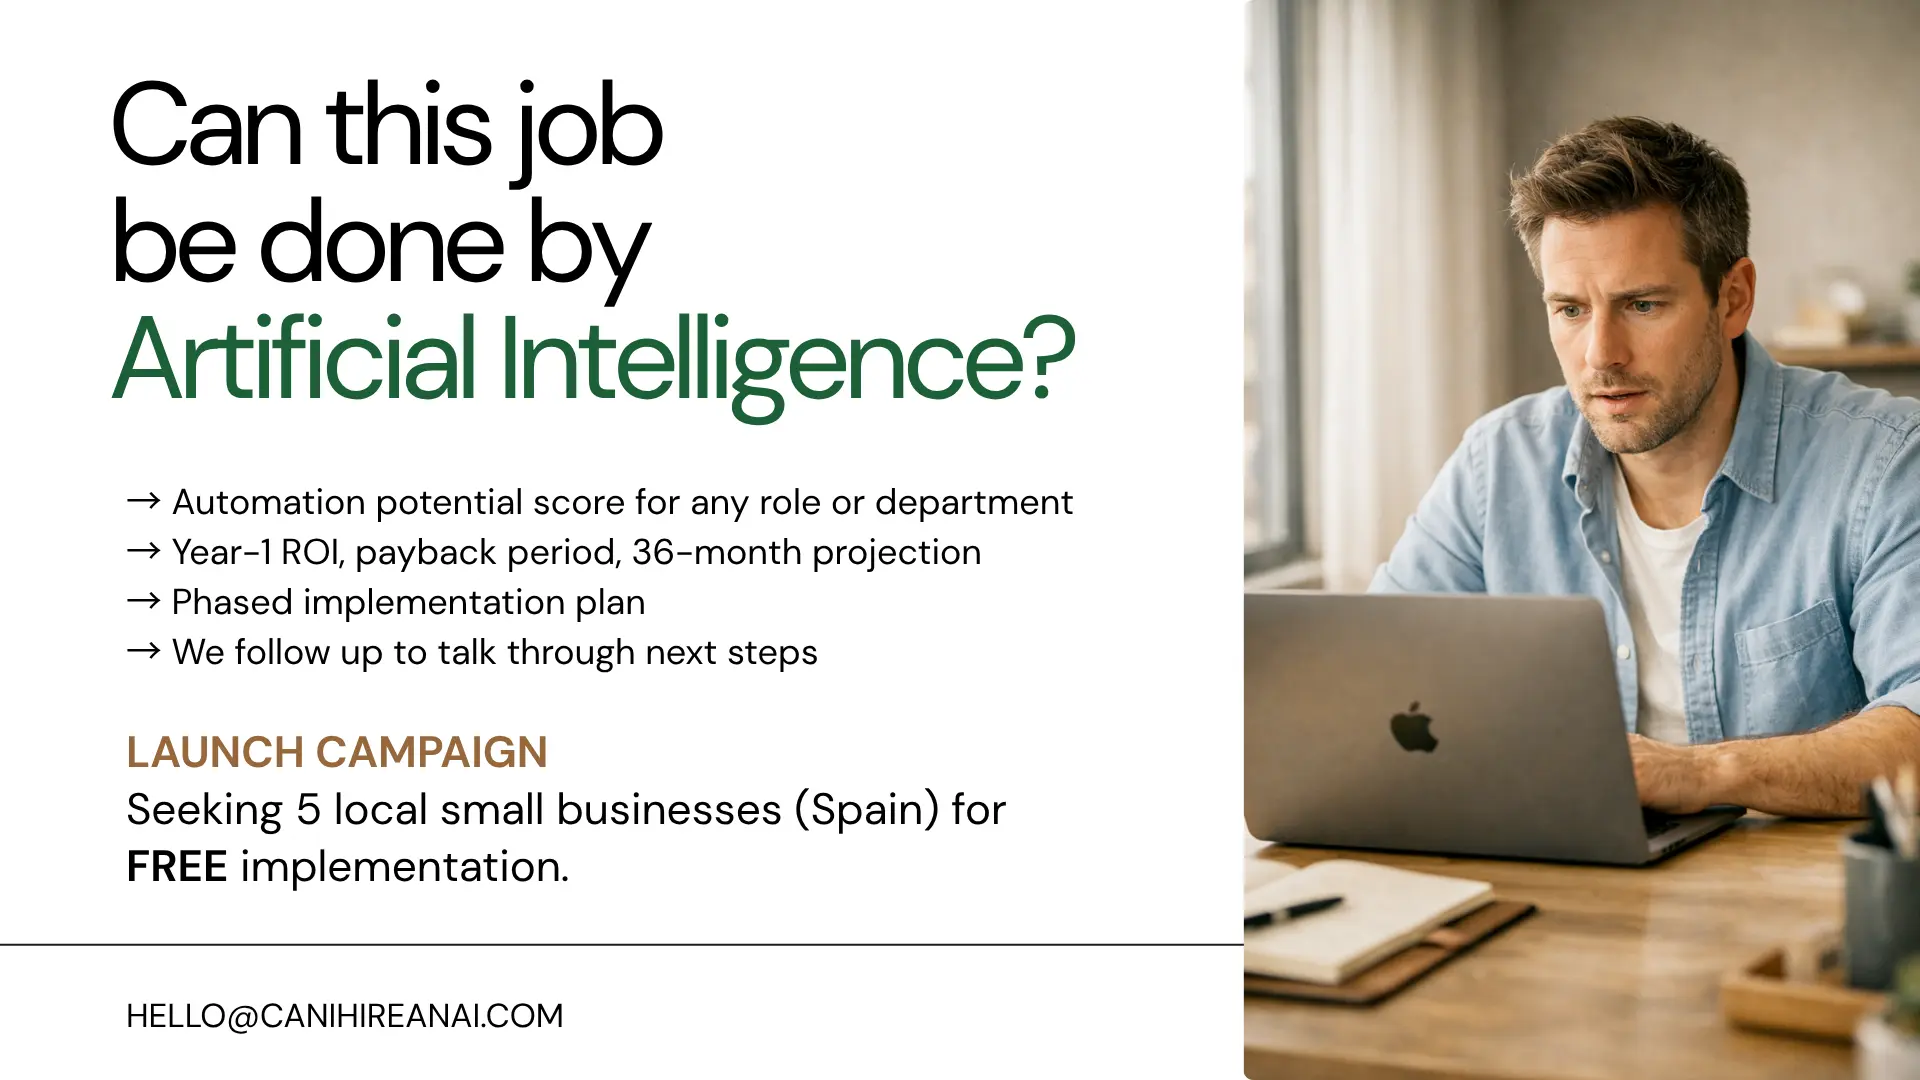
The diagnostic at canihireanai.com is free for everyone. No signup, no sales call, no credit card — just run it. That’s not the offer here.
The offer is different: for launch, we’re opening 5 spots for local companies (Spain) to receive a complete, free implementation of the automation the diagnostic identifies. We build it. We deploy it. We hand it off to your team. At no cost.
What you get:
- Full AI automation analysis — free for all, no slot required for this part.
- Complete end-to-end implementation of the proposed automation: integrations, testing, supervised pilot, and deployment.
- A phased rollout with ongoing support until your team is running it independently.
What we ask:
- A public review once the project is live (Google, LinkedIn, or a written testimonial).
Who this is for: Local companies (Spain) with 10+ employees who have a clear role or process they want to automate — and are ready to move from analysis to action.
These aren’t analysis slots. The tool is free for everyone. These are five real implementation projects, delivered at no cost.
Comment “INTERESTED” on the LinkedIn post or DM us directly. Deadline: Friday, May 1st.
Why free?
We’re an AI automation agency. We build and implement these systems for clients.
The analysis is free because the hard part isn’t knowing what to automate — it’s actually doing it. The tool gives you a structured starting point. If the numbers make the case, and you want to move from analysis to implementation, that’s the conversation we’re set up for.
There’s no pressure in either direction. A lot of people run an analysis and decide the timing isn’t right, or they handle implementation internally. That’s a completely valid outcome. The tool exists to give you honest numbers — what you do with them is up to you.
Not sure where to start? Browse real examples of analyses — roles, departments, and tasks — to see what the tool produces before you run your own.
Find out what AI could actually do for your team
Most companies have at least one role, process, or department where automation would pay for itself within a year. The hard part is knowing which one — and what it would really cost.
Run a free analysis at canihireanai.com. Describe a role, a department, or a set of tasks. Get your automation score, ROI projection, and payback period, — in under 5 minutes.
No consultant. No signup required to start. No sales call before you see the numbers.